What our 70+ page report
actually contains — and how
we produce it.
Our feasibility assessment covers seven distinct areas of analysis, each producing a dedicated report section. Every section is built from project-specific satellite data and expert analysis — not from standard templates applied to generic regional inputs. Below is what each section contains, where the data comes from, and why it matters.
70+
pages per report
7
assessment areas
30+
data sources
100%
remote — no site visit
Forestry carbon projects have been documented to overcredit by 5–14× their stated value due to incorrect baseline assumptions. For cookstoves, systematic use of fNRB values of 80%+ against a regional benchmark of 25–35% has produced over-crediting documented at 6× average by UC Berkeley (Nature Sustainability, 2024).
These are methodology failures — and they start at the feasibility assessment stage. Our methodology is designed to identify them before you commit capital.
Seven sections. Every material factor covered.
Land & Baseline Characterisation
8–12 pages
6 components
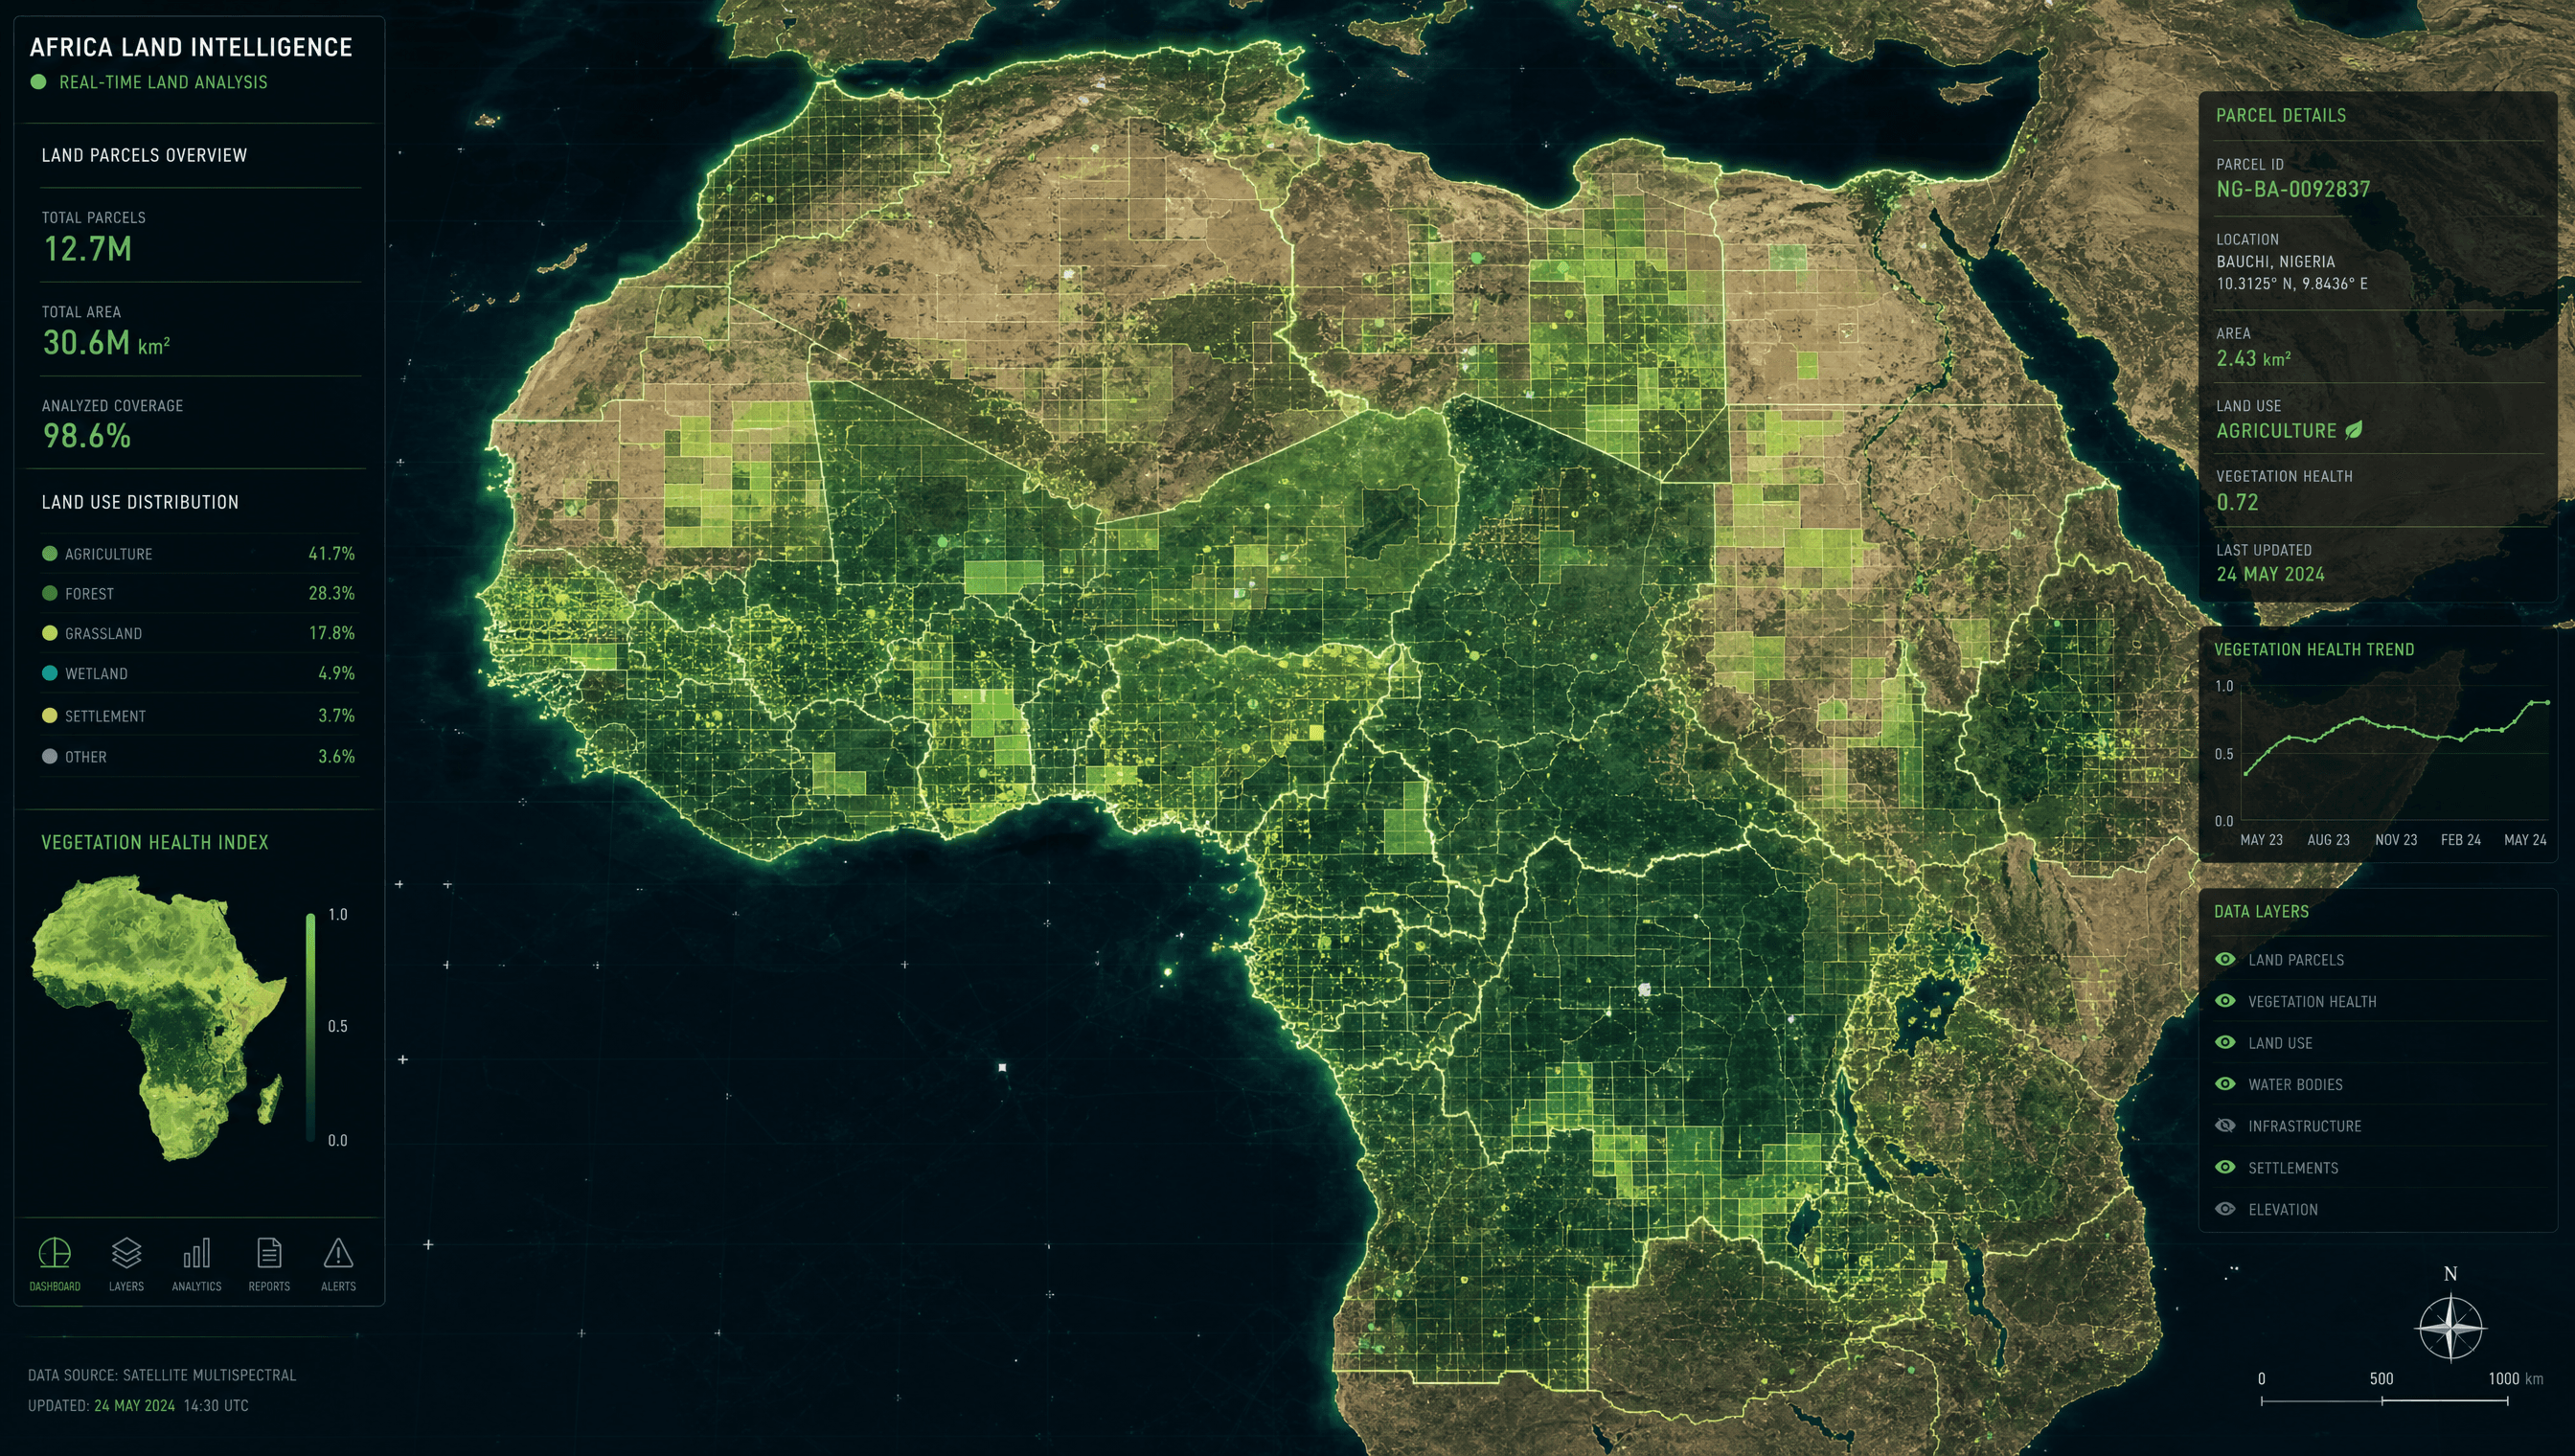
Every assessment begins with a complete characterisation of the land parcel — its current state, its history, and its biophysical context. We do not use regional averages. We build the baseline from project-specific satellite data.
Land parcel boundary verification
Satellite-derived confirmation of stated land coordinates. Identification of overlapping designations (protected areas, concessions, conservation easements) via WDPA and national registry cross-check.
NDVI time-series analysis (10-year minimum)
Normalised Difference Vegetation Index calculated from Sentinel-2 imagery across the full historical archive. Seasonal variation modelled separately from structural degradation trends. Used to establish vegetation productivity baseline and identify historical clearance events.
Tree crown cover classification
Random Forest classifier applied to multi-spectral imagery to produce land cover map at project-relevant categories: dense forest, open forest, scrubland, grassland, cropland, bare land, water. Minimum mapping unit: 0.5 ha. Accuracy assessed via confusion matrix with minimum 85% overall accuracy requirement.
Above-ground biomass estimation
Above-ground biomass (AGB) derived from JAXA PALSAR-2 L-band SAR backscatter, calibrated against national biomass datasets and published allometric equations for the relevant forest type and geography. Below-ground biomass estimated via root:shoot ratio per IPCC Tier 1 or regional equations where available.
Historical deforestation rate analysis
Annual deforestation rates calculated for the project area and a 50km reference region for the most recent 10 years, using Hansen et al. forest cover change data. Rates compared to national and subnational benchmarks. Critically: we use project-area-specific rates, not country averages — a methodological distinction that determines additionality validity.
Soil carbon assessment
For reforestation and agroforestry projects, soil organic carbon (SOC) estimated from SoilGrids 2.0 (250m) calibrated where available against national soil surveys. SOC change modelling applied per RothC or IPCC Tier 2 approach based on project type.
Additionality Assessment
10–15 pages
5 components
Additionality is the most consequential test in carbon project development and the most frequently failed at certification. Our additionality analysis is built on current project-specific evidence — not generic conclusions from standard templates.
Regulatory surplus test
Assessment of whether the project activity is legally mandated at local, national, or international level. We check: national REDD+ policies and NDC commitments, national forest codes, land use regulations, renewable energy mandates. Critically assessed against the legislation in force at the time of assessment — not historical versions.
Investment barrier analysis
Financial model demonstrating that the project cannot proceed without carbon revenue. Inputs: current commodity prices (timber, agriculture) for the specific crop/species and regional market, current land acquisition costs, current local financing rates, country risk premium, and the carbon revenue required to achieve a market-comparable internal rate of return. Sensitivity analysis performed across commodity price and discount rate assumptions.
Institutional and technology barrier analysis
For project types where financial analysis alone is insufficient (typically for community-based or smallholder projects), assessment of barriers including: land tenure insecurity, lack of technical expertise, absence of carbon market access, political/governance instability. Each barrier documented with current supporting evidence.
Common practice analysis
Assessment of whether comparable activities — reforestation, agroforestry, cookstove distribution — are occurring without carbon finance in the same geographic and socioeconomic context. Data sources include national land use statistics, NGO programme databases, and local government agricultural records. Used to determine whether the project activity represents a departure from common practice.
Additionality risk rating
Conclusion expressed as a structured risk rating (High / Medium / Low / Insufficient evidence) with full evidence trail. Where additionality is marginal or uncertain, the specific conditions that would need to be satisfied for a stronger case are documented.
Carbon Potential Quantification
12–18 pages
5 components
Carbon potential is calculated per the applicable methodology with full transparency of assumptions. Every variable that materially drives the estimate is documented with its source, its uncertainty range, and its sensitivity contribution.
Gross removal / avoidance calculation
Annual carbon sequestration (for reforestation/agroforestry/ARR) or emission avoidance (for cookstoves) calculated per the applicable VCS, Gold Standard, or Plan Vivo methodology. For forestry: growth curves applied per species and climate zone from national or regional yield tables. For cookstoves: emission reduction per stove calculated using fuel consumption surveys and validated combustion efficiency data.
Leakage deduction
Activity-shifting leakage assessed where the project displaces carbon-emitting activities to outside the project boundary. Leakage belt defined per methodology requirements. Market leakage assessed for timber/agricultural commodity projects using commodity supply elasticity data. Net leakage deduction calculated per methodology — typically 10–40% of gross removals depending on project type and geography.
Buffer pool contribution
Non-permanence risk rating calculated per Verra's Non-Permanence Risk Tool (or equivalent for other standards). Factors assessed: project risk, natural risk (fire, disease, climate), and socioeconomic risk. Buffer pool contribution typically 10–30% of net removals. Documented with full risk tool scores.
Net credit projection
Annual net credits (tCO₂e) calculated over full project lifetime (typically 20–40 years). Projections presented at: Year 1 (expected), Years 1–5 (cumulative), Years 1–10, full lifetime. Confidence ranges expressed as P10/P50/P90 based on sensitivity analysis of key growth / emission factor assumptions.
fNRB validation (cookstove projects)
For cookstove and biomass projects, the fraction of non-renewable biomass (fNRB) is validated against current regional data. We do not use the industry-average assumption of 80%+ that has driven systematic overcrediting. We apply MoFuSS values per Verra's VM0050 (October 2024) or equivalent Gold Standard methodology, supplemented by available national energy surveys and field data.
Certification & Compliance Analysis
8–12 pages
5 components
We assess the project against the current version of each applicable standard — not historical methodology documents. Standards are updated regularly; projects developed against outdated requirements may not satisfy current registration criteria.
Standard selection and rationale
Assessment of which standard(s) the project can credibly pursue, based on: project type, geographic eligibility criteria, community benefit requirements, credit market preferences, and timeline/cost trade-offs. For projects that could satisfy multiple standards, a comparison is provided.
Methodology applicability confirmation
Detailed assessment of whether the project meets the applicability conditions of the proposed methodology — including land eligibility, ecological parameters, geographic constraints, and legal requirements. Non-conformances are documented with their materiality.
Gap analysis against current requirements
Systematic comparison of project current state against what is required for registration. Gaps identified across: project design, documentation, stakeholder consultation, monitoring plan, and legal basis. Each gap rated by materiality and by the effort required to close it.
Validation and verification pathway
Recommended VVB (Validation/Verification Body) from the list of currently accredited VVBs with active capacity in the relevant standard and geography. Indicative VVB cost range and timeline to validation. Key areas of VVB scrutiny identified based on project type.
ICVCM Core Carbon Principles alignment
Assessment against the ICVCM's Core Carbon Principles (CCPs) — the emerging institutional benchmark for high-quality credits. Projects aligned with CCPs command premium pricing and are preferred by institutional buyers. CCP alignment mapped against project design.
Risk Register
8–10 pages
5 components
Every material risk to project viability, credit integrity, and long-term permanence is documented with a risk rating, supporting evidence, and — where mitigants exist — recommended risk mitigation approaches.
Permanence risk — natural
Assessment of natural risks that could reverse sequestered carbon: wildfire (based on historical fire frequency and projected climate trends), drought (CHIRPS precipitation data, SPEI drought index), pest/disease (species-specific vulnerability, regional outbreak data), storm events (tropical cyclone track data for relevant geographies). Mapped against the Verra non-permanence risk tool scoring criteria.
Permanence risk — socioeconomic
Assessment of human-driven permanence risks: land tenure security (documented ownership structure, dispute history), local economic pressures (agricultural commodity prices, population density trends), governance stability (INFORM score, World Bank governance indicators). Leakage belt assessment included where applicable.
Additionality risk
Residual additionality risk after the main additionality assessment — specifically, the risk that changed conditions (commodity prices, policy changes, improved financing access) could undermine the additionality case during the project lifetime. Scenarios documented.
Methodology risk
Risk that the applicable methodology is revised in ways that materially affect credit volumes or eligibility. Relevant pending methodology revisions documented. Impact assessment for the most likely revision scenarios.
Market risk
Carbon price sensitivity analysis: credit revenue projections at P10/P50/P90 carbon price scenarios using current VCM price data by credit type and standard. Breakeven carbon price calculated.
Financial Projections
10–12 pages
5 components
Financial projections are built from the carbon potential estimates in Section 03, current market pricing by credit type, and indicative development cost benchmarks from comparable certified projects.
Carbon revenue model
Annual and cumulative carbon revenue projected over project lifetime at: Bear case (P10 carbon price), Base case (P50 current market price for the applicable credit type), Bull case (P90 forward curve / analyst consensus). Revenue net of estimated royalties, buffer pool contributions, and transaction costs.
Development cost estimates
Indicative cost estimates for PDD development ($15,000–$30,000 depending on methodology complexity), VVB validation ($15,000–$25,000 for first validation), initial project implementation (land preparation, community engagement, monitoring infrastructure). Based on comparable projects in the region and project type.
Timeline to first credit issuance
Estimated timeline from today to first credit issuance: PDD development, VVB validation, standard registration, first monitoring period, first verification. Typically 18–36 months depending on project type and geography. Critical path identified.
Net present value analysis
NPV of projected credit revenue less development costs at bear/base/bull scenarios. IRR calculated at base case. Breakeven analysis: minimum credit volume required to recover development costs. Breakeven carbon price at expected credit volume.
Sensitivity analysis
Tornado chart showing contribution of each key assumption to NPV variance. Top 5 drivers identified. Scenarios modelled: ±30% carbon price, ±15% credit volume, ±50% development cost, timeline scenarios (12/18/24/36 months to first credit).
Development Pathway & Recommendations
6–8 pages
5 components
The final section translates assessment findings into a concrete development roadmap — what needs to happen, in what order, at what cost, and with what expected outcome.
Go / No-go recommendation
Clear recommendation with supporting rationale. Where the recommendation is "go with conditions", the conditions are documented specifically — what needs to be resolved before committing to PDD development.
Recommended certification pathway
Specific methodology and standard recommended, with rationale. Alternative pathways documented where more than one is viable. Key decision points and their timing identified.
PDD development scope
Summary of what the PDD will need to contain based on the methodology applicability and gap analysis. Estimated PDD development scope and cost. Recommended approach to VVB selection and engagement timing.
Monitoring, Reporting and Verification plan outline
Summary of ongoing MRV requirements: monitoring parameters, monitoring frequency, data management requirements, verification periodicity, estimated ongoing MRV cost per year.
Next steps and timeline
Recommended immediate next steps following report delivery, with indicative timelines. Where Feasibility.Earth is able to support the development phase, scope and terms outlined.
Assessed against standards as they are today — not as they were.
Verra VCS, Gold Standard, and Plan Vivo all revised their methodology requirements significantly in 2024. Projects assessed against earlier versions may not satisfy current registration criteria. We work from the current published methodology version at the date of each assessment.
VM0047, VM0042, AMS-II.G, VM0050 (cookstoves, Oct 2024)
TPDDTEC, LUF Activity Requirements, revised fNRB requirements
Community benefit-sharing, PV Carbon Standard v2.2
CCP eligibility assessment for institutional buyer alignment
Specific differences from standard
desk-based assessment practice
Standard practice
Country or regional average deforestation rates
Our approach
Project-area-specific deforestation rates from 10-year Hansen forest cover change analysis
Prevents additionality claims based on high-deforestation benchmarks applied to low-pressure areas
Standard practice
Industry-average fNRB values (80%+) for cookstove projects
Our approach
MoFuSS-aligned regional fNRB values validated against national energy surveys, per VM0050 (Oct 2024)
Prevents the 2–6× overcrediting documented in UC Berkeley and Calyx Global research
Standard practice
Investment analysis based on generalised commodity price assumptions
Our approach
Current regional commodity prices, current local financing rates, country-specific risk premium
Additionality case reflects current economic conditions, not conditions from when a template was written
Standard practice
Tree crown cover estimated from global 30m datasets
Our approach
Sentinel-2 10m classification with project-specific validation — accuracy assessed via confusion matrix
Biomass and carbon stock estimates 3–5× more precise than 30m-based estimates for small parcels
Standard practice
Buffer pool estimated at standard 10% without full risk tool
Our approach
Full Verra Non-Permanence Risk Tool scoring with project-specific natural, project, and socioeconomic risk inputs
Buffer pool accurately reflects actual permanence risk — avoiding both under- and over-reserving
Standard practice
Leakage deducted at fixed percentage without activity-shifting analysis
Our approach
Activity-shifting leakage modelled from land use pressure data in the leakage belt; market leakage assessed via commodity supply elasticity
Net credit estimate reflects real displacement risk rather than a formulaic deduction
Ready to assess your project?
Start with a $500 eligibility check or go straight to the full 70+ page feasibility study.